Archive
Global view– How Current Accounts can help set-up a bearish (EM) play
Finally it is FOMC’s day, the market is soon going to resume moving – up or down… I have already given my preferred play last week – the bearish scenario, mostly based on the trending potential of squeezed assets. But Current Accounts are also worth having a look at to help in trade selection, or simply to realize how much the EM and Commodity miracles have changed in the last two years.
The press has well covered the current squeeze in credit markets (here and here). Retail investors are over-loaded with credit and bond ETFs, while banks have sharply reduced their market making / risk taking capacities… so that there is little liquidity left, particularly in times of rush to the exits. Exactly the kind of situation we should be looking for, so shorting US credit markets would be a good bearish vehicle if Bernanke fails to reinsure markets.
The other asset class where investors are over-exposed is EM markets. When considering things globally, having a look at current accounts is always very instructive, and here one can see quickly that things have changed significantly over the last one or two years. For readers not used to this concept, a current account has to be understood in two ways (I am simplifying of course). One, it tells you whether a country is benefiting or contributing to the Rest of the World’s (RoW) demand. For instance, the US with its deficit has been helping the rest of the World’s GDP grow, thanks to its very strong domestic demand. While, on the contrary Germany has been benefiting from the RoW demand. Second, it tells you whether a country needs capital from the RoW or whether it exports some. Japan and China for instance have been exporting capital for years. That’s important because a country with a large CA deficit is very vulnerable in times of reduced market confidence and outflows (as we could see in coming semesters).

First let’s have a global look. Global imbalances are back, the horizontal conic shape is back, showing an ever more imbalanced world – that’s too bad because that situation strongly contributed to the 2007 crisis because of excess global savings. On the deficit side there is still the US, and on the surplus side China, Germany and Japan and the Oil exporters. Not such a surprising situation when Europe is in recession and China is going through its structural rebalancing. Again, most hopes go to the US consumer.
Let’s go into more details, which is relevant for a local / RV analysis. There are important shifts going on. Look at Brazil and India… two of the star BRIC group. Brazil shifted from a minor CA surplus to a big deficit. That’s what happens when you try to boost consumption, while your China centered commodity exports fall. Same for India, from a flat CA, it is moving quickly into increasing deficits. Growth collapse because of bad policies (see my last post) and budget issues are likely central in that move. Also interesting, the G10 commodity exporters – Australia and Canada – they have shifted from flat current accounts to fast increasing deficits… again like for Brazil, it is a case of strong domestic demand and falling exports.
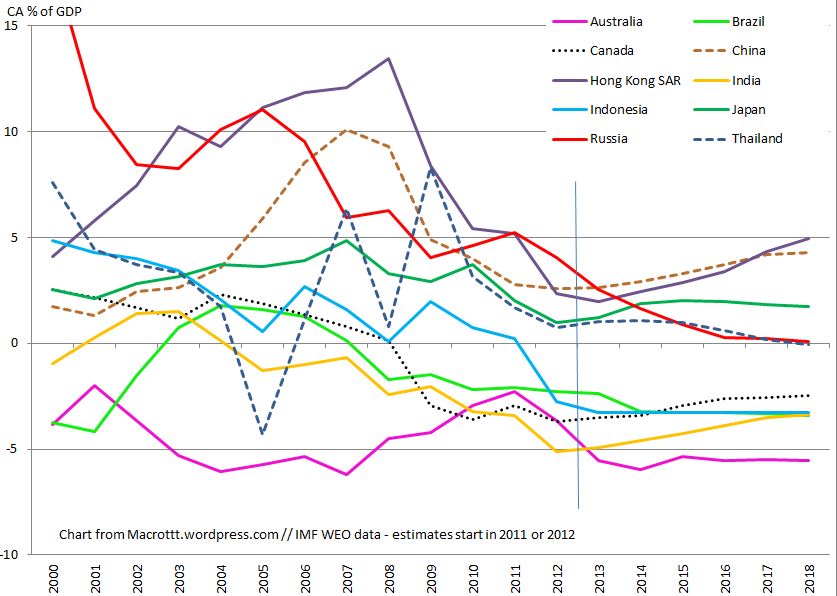
Now let’s have a look at the shifts in more details, in this second graph. Let’s start with the BRICS. India and Brazil are now well into negative territories, at about -5% and -2.5 % of GDP. And Russia also saw a sharp drop of its surplus. Where is the BRIC’s miracle? We saw above the G10 commodity exporters Australia and Canada – not nice either, between -5% and -3.5%… not exactly what is supposed to happen within a booming commodity exporter, whose currencies have been heavily accumulated by SWF, CBs and Wealth Managers. Admittedly, BRL, INR, and AUD have already well corrected, but the CA shifts are impressive. It could definitely push these currencies much lower.
Let’s have a look at a third group now from EM Asia – Honk Kong, Thailand, and Indonesia. Like China, their CA surpluses have sharply dropped. I have not yet checked in details at the reasons for these drops, but I am pretty sure that the consumption boom in Thailand, and the rebalancing to domestic consumption models in countries like Hong Kong and Singapore are important factors. For Thailand which remains an export led economy it is quite worrying. The worst is Indonesia, once a booming export economy that had the chance of being also a commodity exporter. It’s CA has shifted from a surplus to a large deficit.
Actually, in the case of Indonesia the CA deficit is now as large as during the 1998 Asian crisis (see the chart below), that’s amazing. In the case of India it is even worse. And everywhere the downtrends of deterioration over the last 2 years are surprisingly sharp… the world we had in mind one year ago has really changed with the shift in China’s growth model. (I have voluntarily hidden the years after 2012, because the IMF tends to consider that CA will adjust to balance, and hence the current trends are less clear).

Without considering an Asian Crisis scenario (EM sovereign debt are now mostly in local currencies rather than dollars, EM FX reserves are overall very high, EM debt are much longer term than in the past), some investors are nonetheless rightly worried about EM vulnerabilities in the context of peaking QE. EM Corporate debts for instance have increased significantly and have remained in dollar. Global investors’ massive exposure to EM also matter, particularly if it is trough ETF (just like in the case of Credit). The JPY drop is a worsening factor as it is affecting all of EM asia’s competitiveness – just like before the 1998’s crisis. So CA deficits are a key discriminating factor.
To conclude: 1/ The world has changed with China’s policy shift. The commodity markets have priced it in H1 2013, but the EM markets have probably just started the process. 2/ From a trading perspective, for those that envision to trade the bearish case, the CA factor suggests that the most vulnerable currencies are AUD, BRL, INR, IDR, CAD and THB, against USD of course.
